Today, using Microsoft Azure, setting up computing environments is easier than ever. You can create multiple networks, subnets, virtual machines, and other numerous networking components in an eyeblink. Managing these complex networks and topologies can become cumbersome and difficult over time. Trying to grasp what-connects-to-what and where exactly that load balancer or subnet is, becomes increasingly difficult in larger environments. Especially when the time comes to troubleshooting and diagnosing problems in such large networks.
Microsoft has an ace up in the sleeve that is here to help us with these daunting tasks and its name is Network Watcher. It is not just a Big Brother or All-seeing eye (like Sauron’s eye, if you’re into Lord of The Rings) but it is a friendly tool that jumps to help in the dark times when it comes to monitoring, troubleshooting, and diagnosing problems with our networks.
As Microsoft constantly updates and enhances Azure components and services, this also applies to Network Watcher as well and you will notice additions and functionality enhancements over time.
Okay, what is Network Watcher so special about? How can it help you?
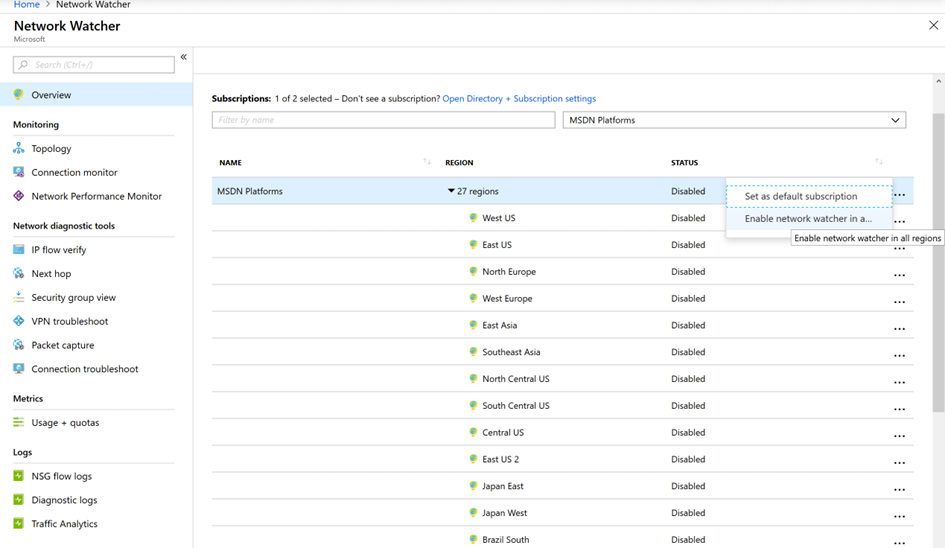
There are a lot of features in it, but before you can use them, you must enable Network Watcher in a subscription and the region where it will be used. If you have multiple subscriptions, it must be enabled for each subscription and region where it will be used.
There are four main sections in Network Watcher blade, Monitoring, Network diagnostic tools, Metrics and Logs. Each section has tools that can help you perform a specific task.
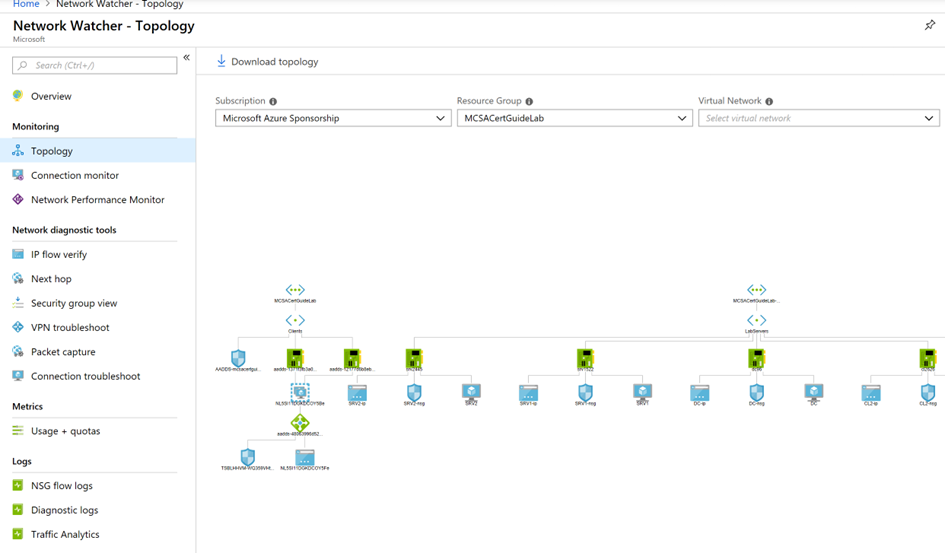
The Monitoring section is a home to Topology tool. Well, you can call it a tool or a feature, but its power becomes evident as soon as you have even slightly complex network infrastructure. It draws a network topology map of your Azure resources and presents it in a nice, graphical way, containing resource-specific icons, resource names, connections between resources and network names. First, select a Subscription, then select a Resource Group and you will be presented a topology of the whole Resource Group. if you have many resource groups, networks, subnets, virtual machines and other resources, the topology diagram might be too big to work with. In this case, you’ll want to narrow the view down to a particular Virtual Network.
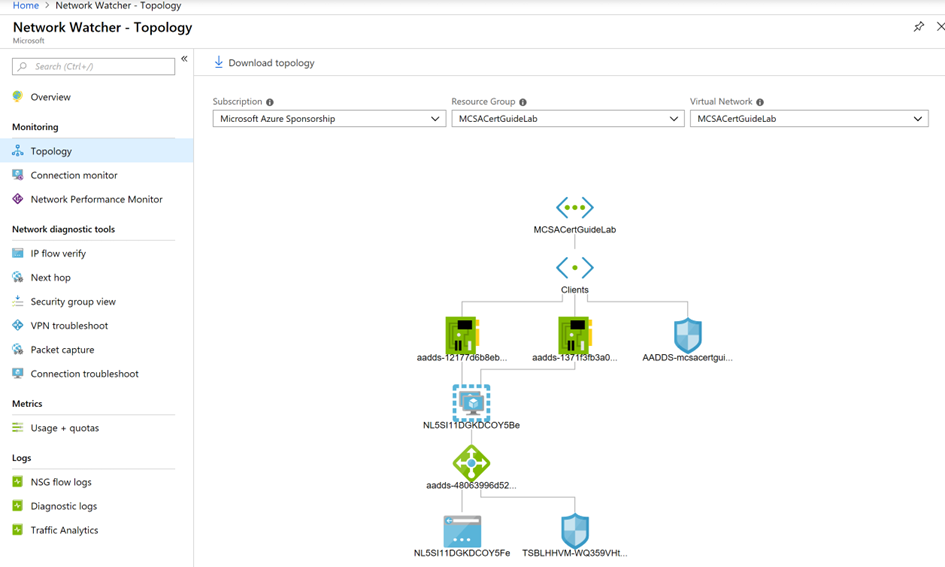
Now, with the specific Virtual Network selected, the topology diagram is much smaller and easily understood. For added convenience, you can also download the topology diagram you are viewing and save it in Scalable Vector Graphics (SVG) format. This file format support many modern and popular programs such as most of the popular browsers, Microsoft Visio, Adobe Illustrator, Adobe Photoshop, CorelDraw and many more.
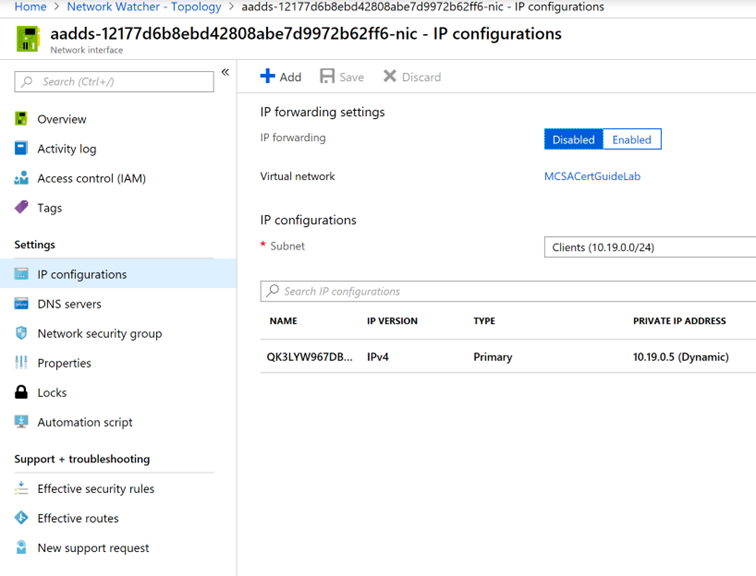
But this is not all! If you click on a resource in the topology diagram, it will open a settings blade for that resource. How convenient – if you need to make change to a resource or view its settings you don’t have to navigate away from the current blade. The resource is just a click away and when you are done with the task, simply close the resource blade and you’ll be back in the Network Watcher Topology view.
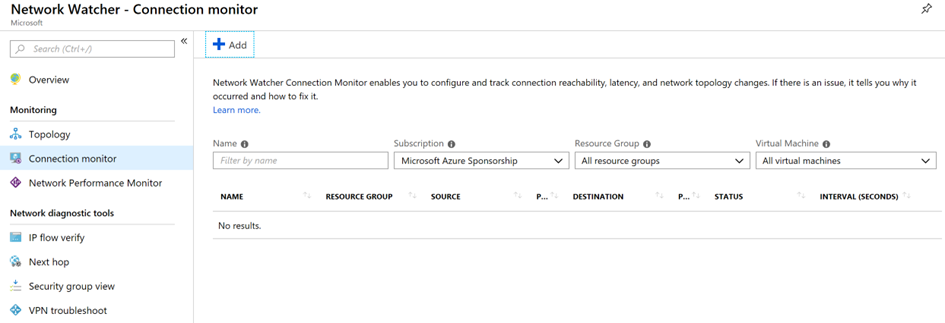
The Connection Monitor is the tool that can help you establish the reliability, reachability, speed and latency of your network infrastructure, as well as possible changes in the topology. In addition, it will tell you what the problem might be and how to fix it.
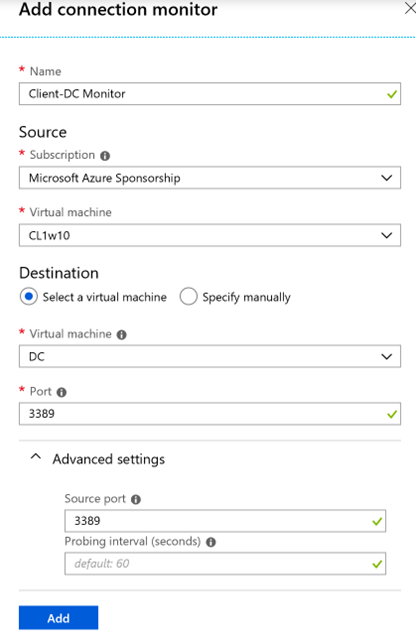
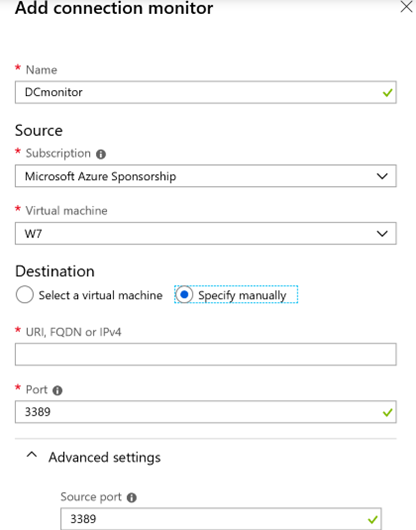
To monitor the connectivity between two resources, click +Add and the blade opens. Here you specify the unique name of the monitor, as well as the Source and the Destination of the resources, that is – virtual machines, you are monitoring. The Source can be any virtual machine from any resource group within previously selected subscription. As a Destination, you can select a virtual machine or specify the resource manually. The manual choice can point to any URL, FQDN or IPv4 of your choice, whether located in Azure or anywhere on the Internet. And yes, it does not have to be a virtual machine, it can be a physical machine or a cloud service, if it can answer back on the service ports. Of course, the Destination resource is supposed to be reachable, but you can create a monitor even if it’s not reachable and monitor the reachability and availability as you proceed with the troubleshooting process. When you specify the destination port, the monitor assumes the source and destination ports are the same. If that is not the case, in Advanced settings, specify a custom source port and probing interval. If you do not specify the probing interval, the default value is 60 seconds and the minimum value is 30 seconds.
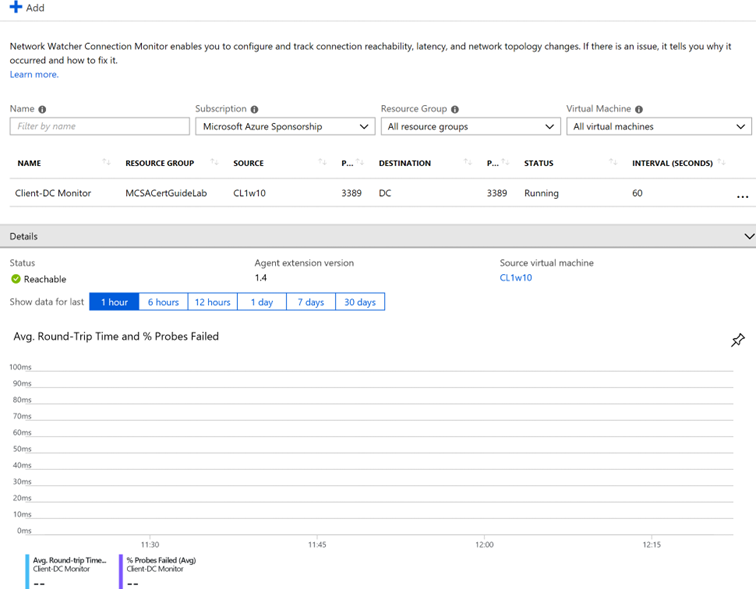
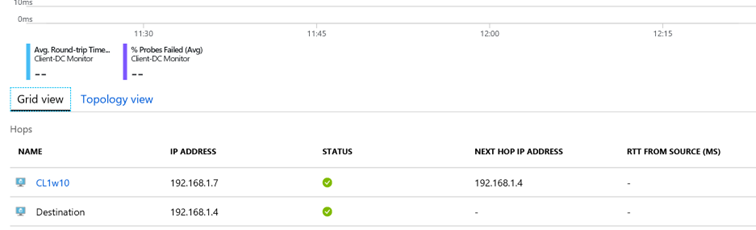
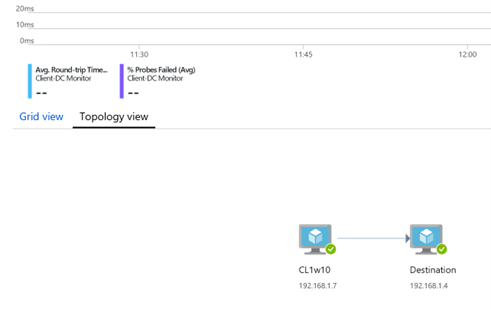
Once created, the Monitor will, guess what? Yes, monitor the connectivity 😊 between the source and the destination! No, it is not so trivial – it will show the graph of the monitoring activity for the past 1, 6 or 12 hours or even for 1, 7 or 30 days. The graph shows average packet round trip time and percent of the packets that never reached the destination. As trivial as it might seem at first, the data gathered presents invaluable information about your network and gives you an incredible insight in how the network behaves. Additionally, it shows the information in grid view and in topology view, with the resources’ IP addresses, connections, and names.
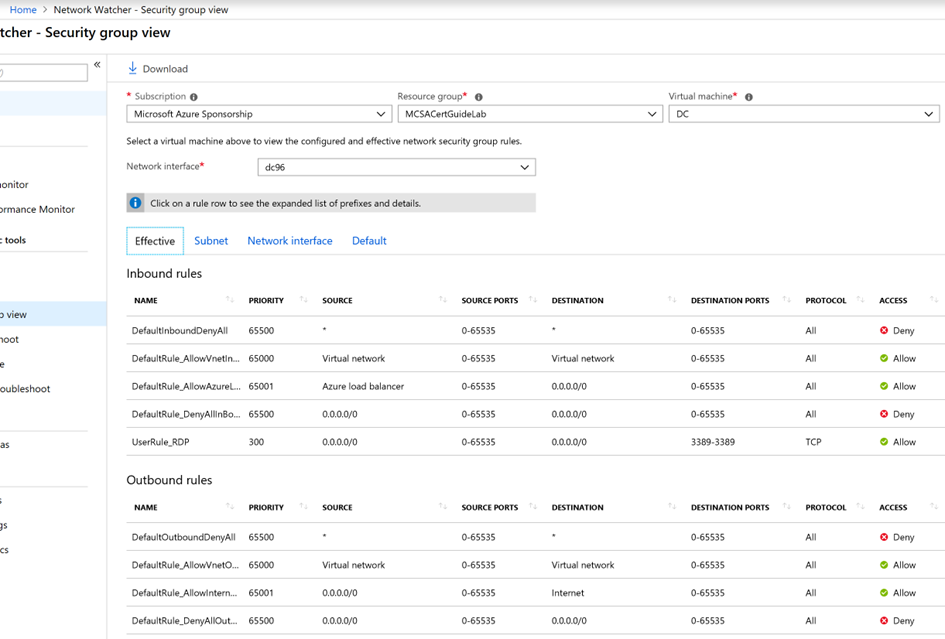
The next Network Monitor hero in line is Security Group View which can show you the information related to the Network Security Groups associated to a virtual machine. Especially useful if you have many NSG rules, this view can save you a lot of headache – it shows you effective NSG rules, so you know exactly which rule is preventing or allowing inbound or outbound traffic. It’ll show you the list and the information about the associated subnets and attached network interfaces.
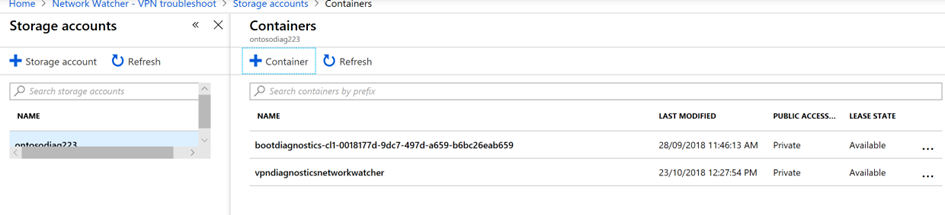
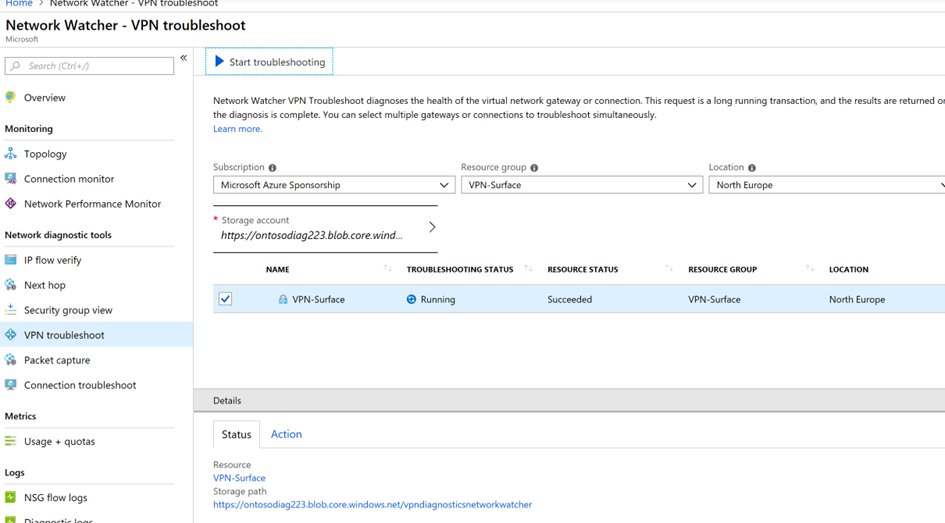
Another common connectivity issues arise in the networking, not only related to on-premises hardware but also to its virtual, cloud-based counterpart – a VPN connection. VPN Troubleshoot tool in Network Watcher can assist in resolving connectivity issues related to VPN connections. It needs a storage account, to be more precise, it needs a Container with access permissions defined where it will store diagnostic data gathered during the troubleshooting process. Once created, the hunt for VPN connectivity problems can begin.
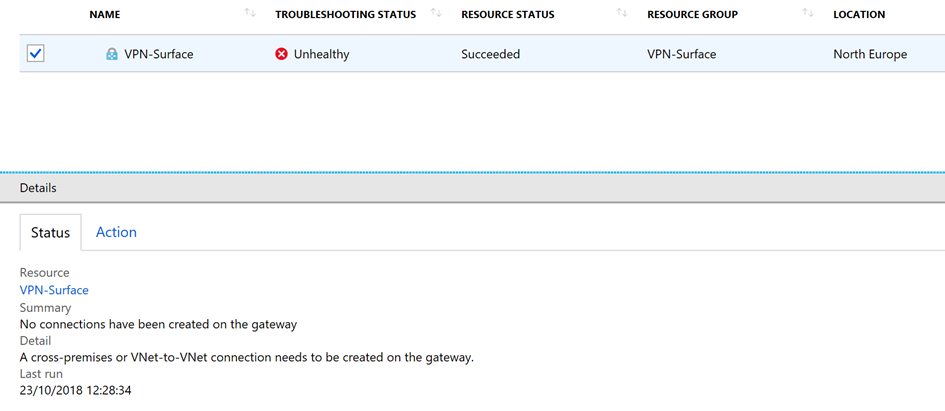
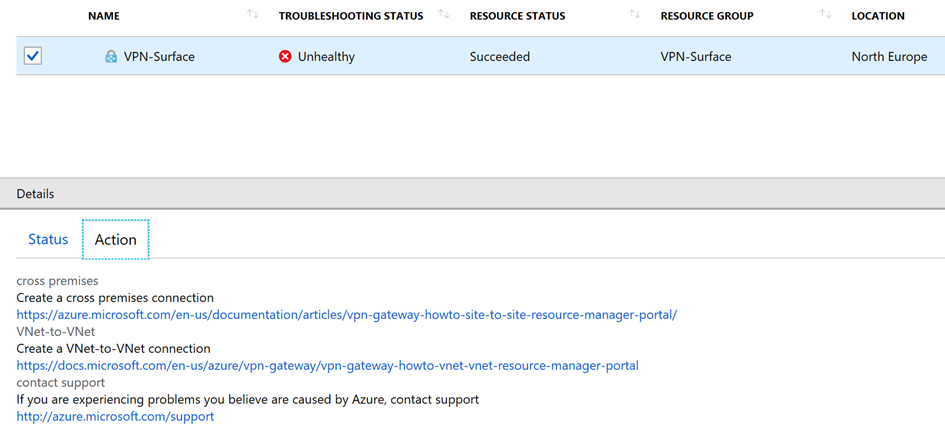
With storage and region defined, click on Start troubleshooting to begin. In few minutes, it will tell you what the problems are or what the problems might be, depending on the complexity of the problem itself. It returns the Status of the troubleshooting process – that is, the reason why the connection is lost, for example – and the actions recommended to solve the connectivity problem, with corresponding links to further enhance the knowledge about the steps.
To perform a deeper troubleshooting process, that goes beyond the infrastructure itself and relates to the monitoring resources, you have the Packet Capture capability available. Without the need to install the monitoring software on either monitoring node, this convenient feature can be started in just few clicks.
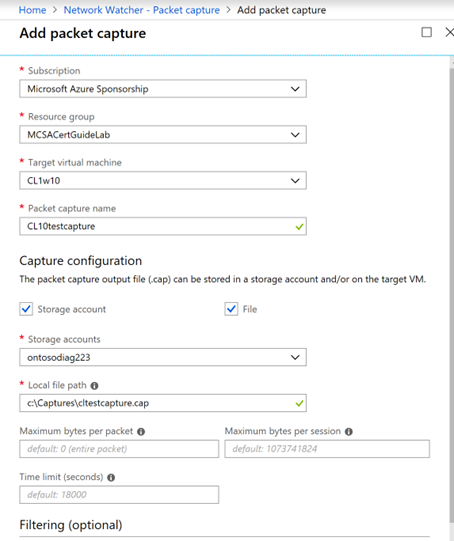
The capture configuration allows to store the captured network packets in the Azure storage account and locally, in a .cap file. It allows tweaking the capture process a little, setting maximum bytes per captured packet, maximum bytes per session and setting a capture session duration time.
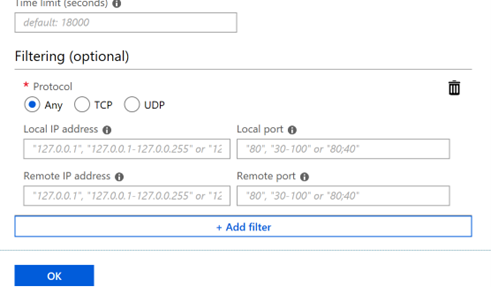
Moreover, fine tuning can be done by creating a capture filter, by protocol or local or remote IP addresses. Once the capture process is done, you can further examine and dissect .cap file in your favourite program.
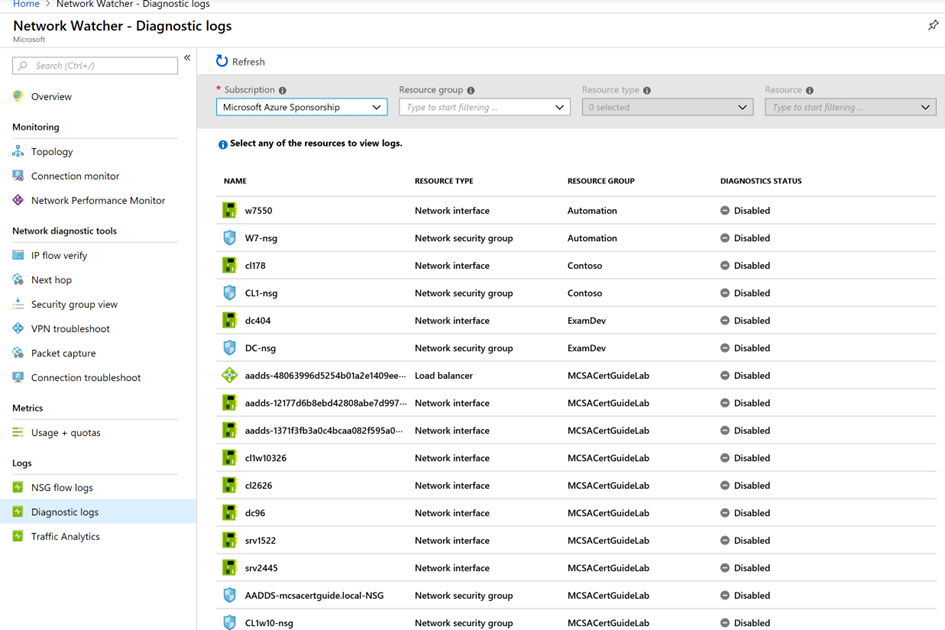
And last but not the least, there is also a detailed overview of resource diagnostic logs. The diagnostics is not enabled by default and if you are in the process of setting up a network and expect connectivity issues to occur, it would be good to enable logging to be able to gather data and analyse it further.
This was an introduction of some of the Network Watcher features and is not a definitive list of its capabilities or functionality. Hope it was interesting and valuable and hope to see you at the next article. Until then, I wish you successful troubleshooting process using Azure Network Watcher!

